
PPF, PPFD, efficacy and DLI: understanding grow-light numbers
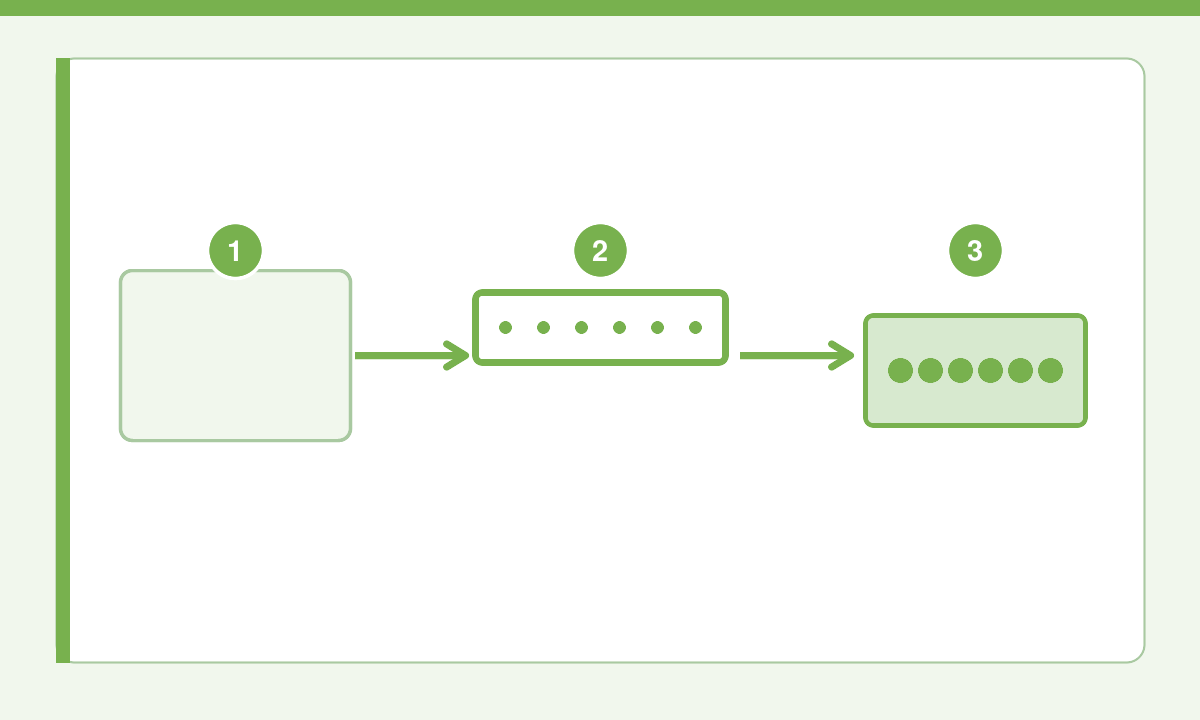
A grow-light specification may show electrical watts, PPF, photon efficacy and a PPFD map. They answer different questions. PPF counts photosynthetic photons emitted each second; PPFD describes the photons reaching a square metre of canopy; DLI sums the exposure over a day. These quantities prevent a central map reading from being mistaken for the total output of a fixture.
Electrical input and emitted photons
Input power in watts (W) describes electricity use and helps size the circuit and thermal load. PPF, photosynthetic photon flux, counts photons in the conventional 400–700 nm PAR band and is expressed in µmol/s. System photon efficacy divides PPF by measured electrical input, giving µmol/J. Because one watt equals one joule per second, an illustrative 500 µmol/s at 200 W equals 2.5 µmol/J. This is arithmetic, not an HLG measurement. Compare complete fixtures at a stated operating setting.
PPFD: light arriving at the canopy
PPFD, photosynthetic photon flux density, measures photon arrival per second and square metre: µmol/m²/s. It refers to a defined plane, often canopy height. A PPFD map records multiple positions on that plane and should state measurement area, fixture height, power setting and conditions. A high PPF does not guarantee uniform PPFD: some photons miss the crop, while others concentrate beneath the centre.
DLI: time matters too
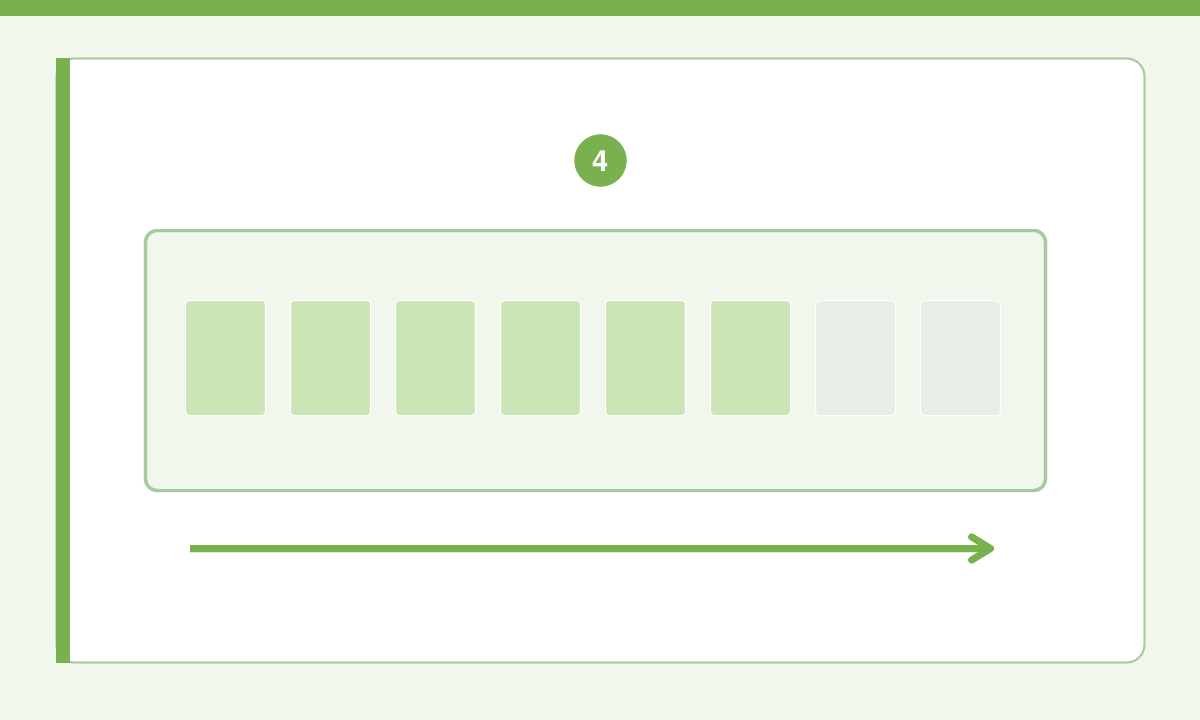
DLI, daily light integral, is the accumulated photosynthetic light at a point, in mol/m²/day. If PPFD remains constant throughout the photoperiod, DLI = PPFD × lighting hours × 0.0036. The factor converts hours to seconds and micromoles to moles.
Worked example: a sensor reads 500 µmol/m²/s at one fixed point for 14 hours, with no daylight or dimmer change. DLI there is 500 × 14 × 0.0036 = 25.2 mol/m²/day. At another point receiving 300 µmol/m²/s, the same schedule gives 15.12 mol/m²/day. These are hypothetical calculations, not HLG readings or universal crop targets.
Swipe sideways to see all units.
| Quantity | Unit | Question answered |
|---|---|---|
| Electrical input | W | How much power is drawn? |
| PPF | µmol/s | How many PAR photons are emitted? |
| System efficacy | µmol/J | How many photons per electrical joule? |
| PPFD | µmol/m²/s | What reaches this canopy position? |
| DLI | mol/m²/day | What reaches it over the day? |
Use commercial figures carefully
Check the exact model, generation, power setting and measurement method. Do not compare one map's peak with another map's average, or maps made at different heights and areas. Colour temperature in kelvins and lumens describe human visual perception; they do not replace a spectral curve or photon data. Crop requirements vary with species, stage, temperature, CO₂ and management, so there is no universal PPFD or DLI target.
To apply these figures to a fixture choice, see the HLG grow-light selection guide.
Further reading : read a PPFD map · set fixture height and power.
Common questions
Can PPF divided by area give PPFD?
Only an idealised average if all counted photons land uniformly on that area. It ignores spill, edges and real distribution.
Can watts calculate electricity use?
Yes: kWh = measured W × hours ÷ 1,000. A constant 330 W for 12 hours is 3.96 kWh for lighting alone; fans and climate equipment add to room consumption.
More HLG articles
 Which HLG light should you choose for your grow tent or room?
 HLG 750 Diablo, Diablo X and Diablo ES: what is different?
 HLG 350 Diablo or 750 Diablo: how should you size your lighting?