
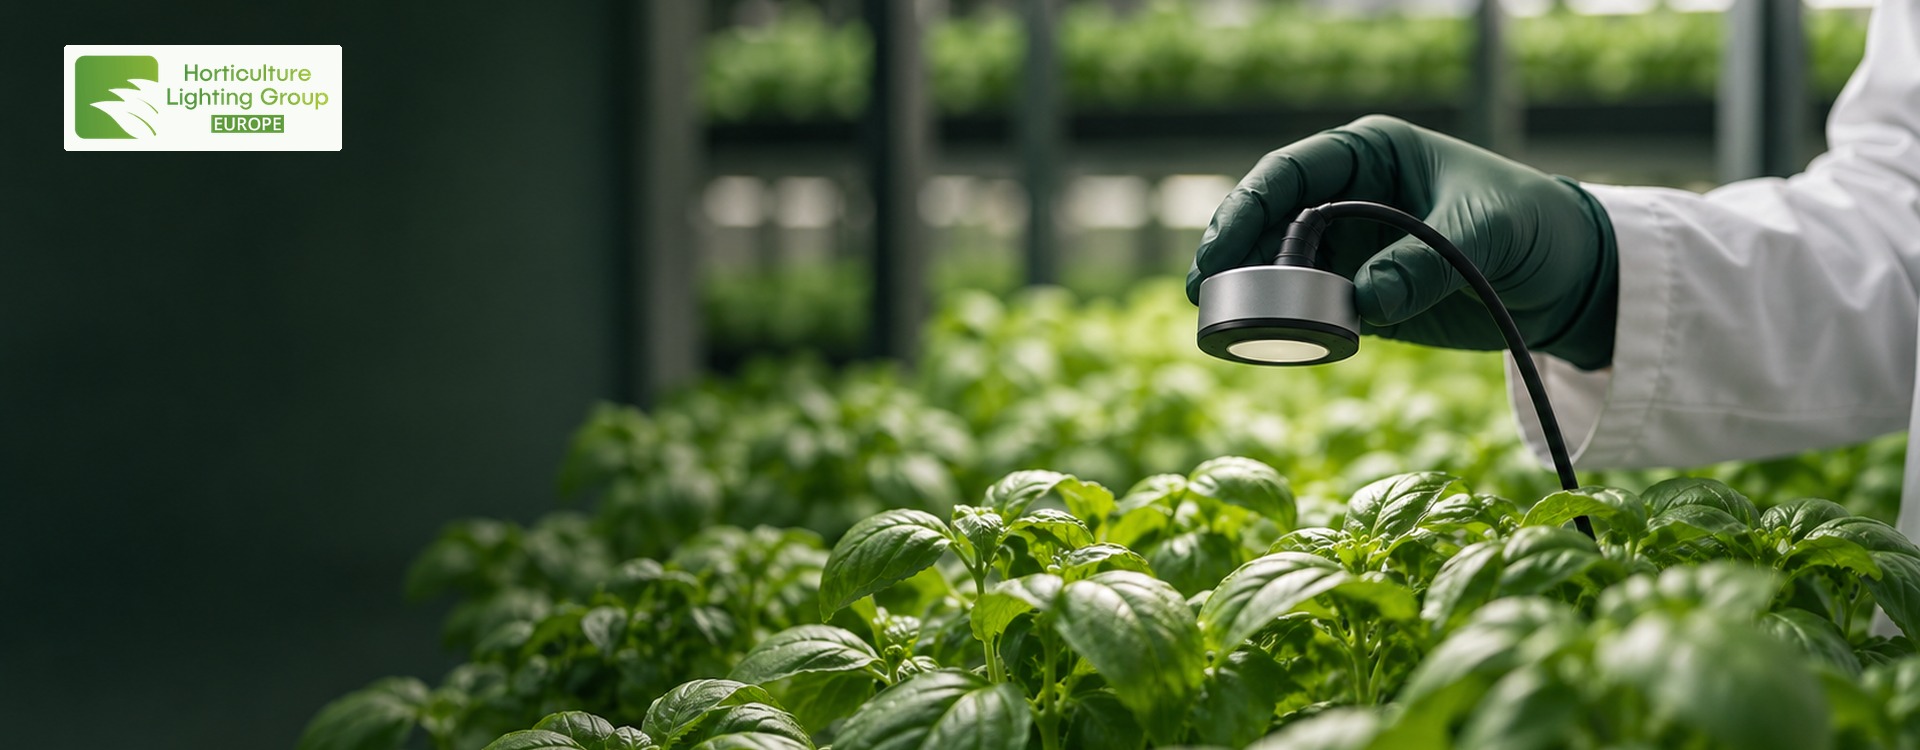
How to read a PPFD map and spot poorly lit areas
A PPFD map describes a defined area at a defined fixture height and power setting. Before looking at the brightest cell, find the measurement area, distance to the sensor and position of every reading. Only then do the average, minimum and uniformity tell you anything useful about your own canopy.
Read the conditions beside the map
Record the exact model, input power or dimmer setting, distance from fixture to measurement plane, grid dimensions and point spacing. Note whether the readings were taken in a reflective tent, an open room or among other lights. Sensor type and calibration also matter. If these conditions are absent, the graphic cannot support a reliable sizing decision. Measure height from the expected canopy top; plant growth changes the geometry.
Look at weak areas, not only the centre
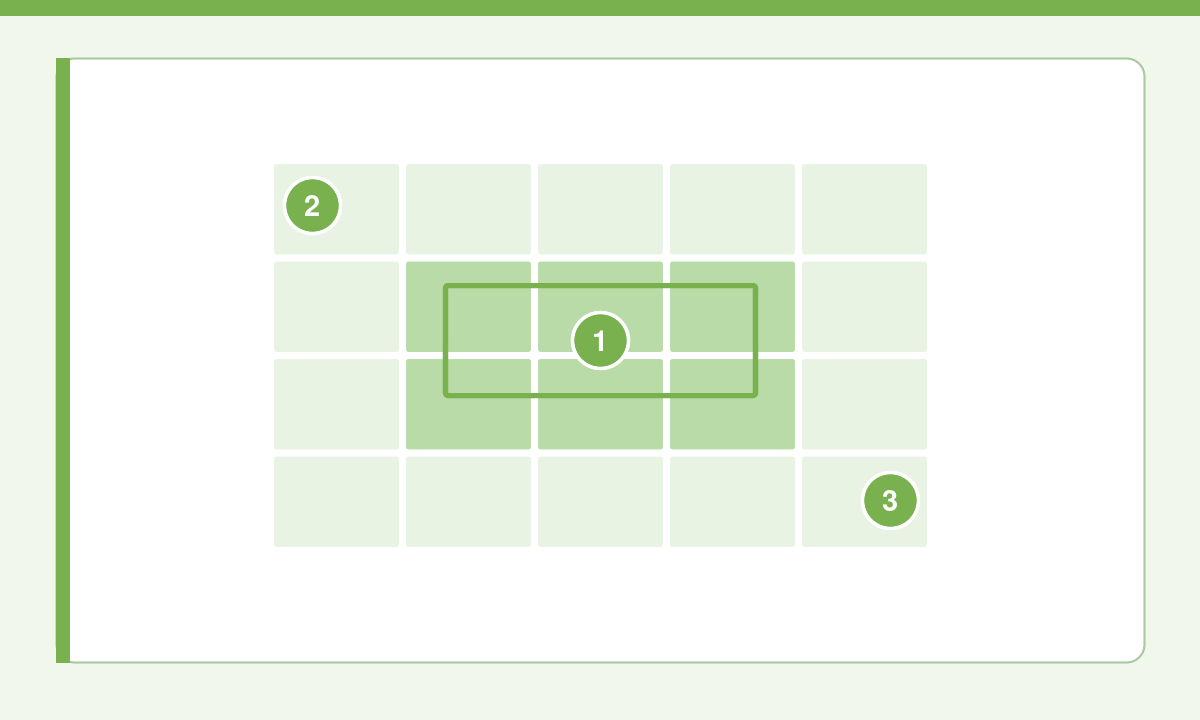
A striking central number can hide dimmer rows at the edges. Take the minimum, maximum and mean of points that fall inside the area you actually cultivate. One simple uniformity measure is minimum ÷ mean; state this definition because other conventions exist. A mean calculated over a small central square cannot be compared with one that includes the outer rows.
Compare two maps methodically
- Use the same cultivated area and a comparable grid shape.
- Check a mounting height feasible for both manuals; declare any difference.
- Record actual electrical power, not just the dimmer percentage.
- Compare mean, minimum, maximum and the location of weak points.
- Check whether wall reflections and neighbouring lights were included.
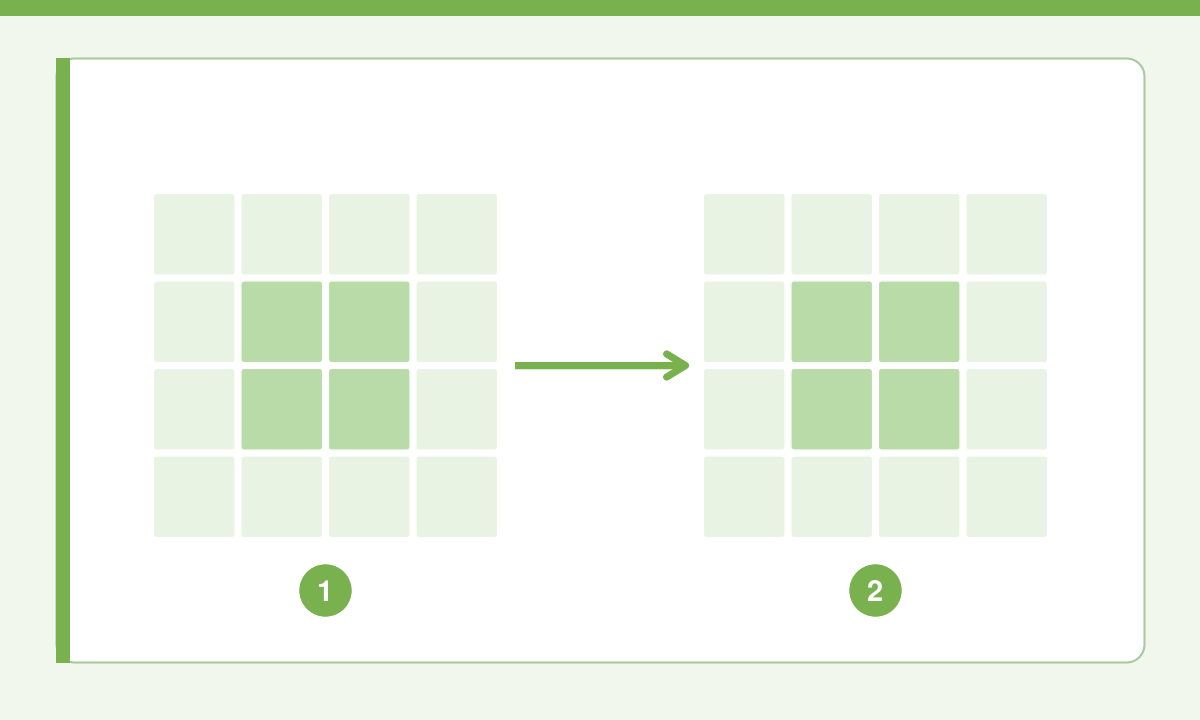
A single central PPFD reading cannot reconstruct a map. Ask for the full grid or take measurements with a suitable quantum sensor. A coloured image without a scale is not a PPFD measurement.
Apply the map to your installation
Coverage is useful only in relation to a species, growth stage and lighting goal. A 120 × 120 cm map cannot establish what happens on a 150 × 100 cm table. Use the HLG grow-light category to identify a specific model, then request its full map and measurement conditions. The guides to PPF, PPFD and height setting explain the next steps.
Further reading : understand PPF, PPFD and DLI · set fixture height and power.
Common questions
Is a high average enough?
No. It may hide weak corners or an excessively bright centre. Examine individual points and the useful share of the crop area.
Are maps at different heights directly comparable?
No. Changing the distance changes both intensity and spread. They can describe alternative scenarios, but the difference must be stated.
More HLG articles
 Which HLG light should you choose for your grow tent or room?
 HLG 750 Diablo, Diablo X and Diablo ES: what is different?
 HLG 350 Diablo or 750 Diablo: how should you size your lighting?